Bangladesh Import Data

Understand market share of your competitors, find importers in Bangladesh and do a lot more with Bangladesh trade data.

6583918+
Shipment Records

87469+
Importers in Bangladesh

10,00,000+
Company Contacts

Bangladesh Trade Data with Detailed Shipment Details

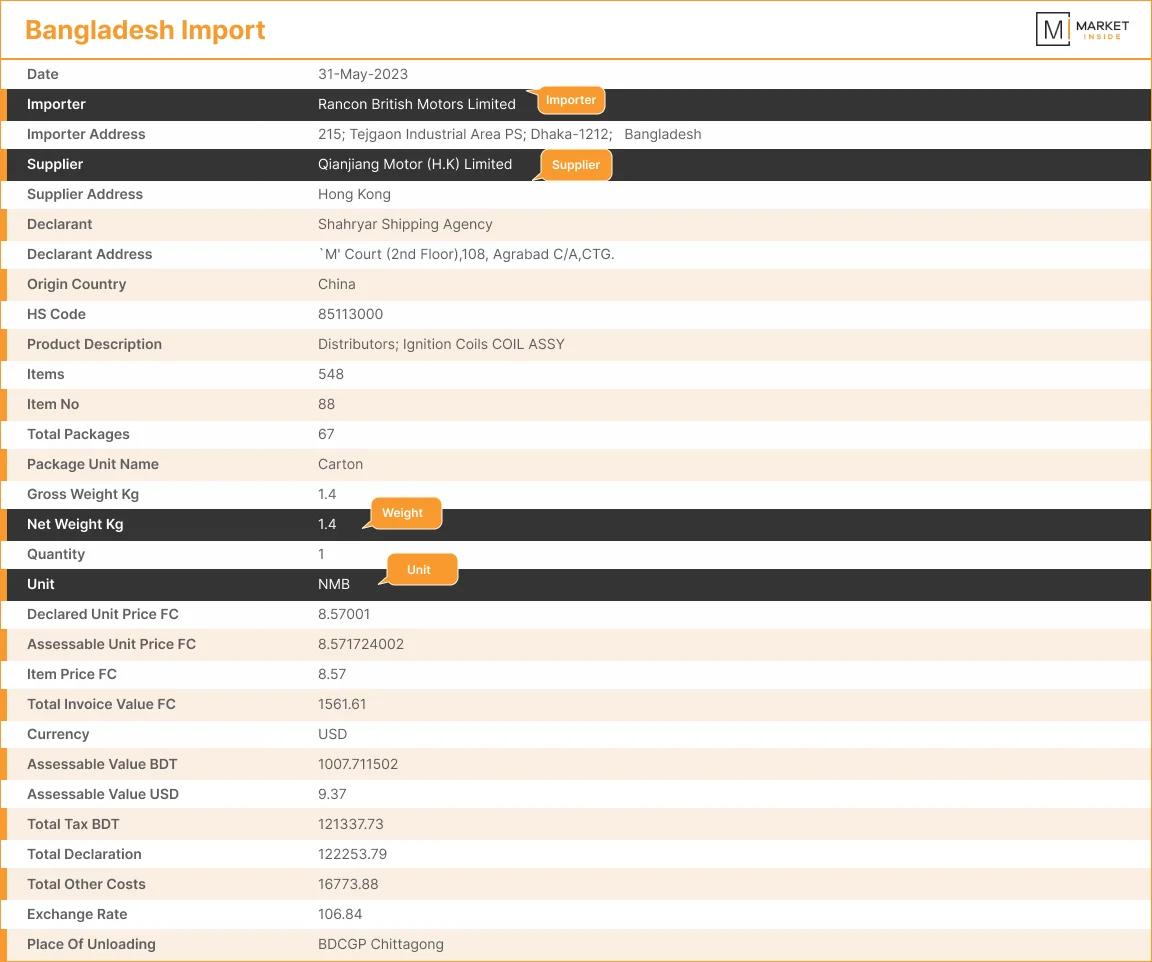
Checkout comprehensive coverage of Bangladesh import market and take data-driven business decisions. Company names, product specifications, value, quantity and many more fields covered in data. Have a look at an example and view full shipment information.


bill of landing page
Download Sample


Commodity-wise Market Analysis

Expand your search and view shipment details of a specific product or industry. Use our customized dashboard and access Bangladesh customs data on HS Classification commodities to grow your business.


specific market analysis

Are you interested in Bangladesh import data?

Bangladesh's Major Import Commodities

Bangladesh stand at rank 49 in global import. Bangladesh Imported goods worth of USD 52 Billion from December 2019 to November 2020, monthly averaged USD 4 billion, reaching an all-time high in Jan 2020 of 6 USD billion and a record low of USD 0 billion in Nov 2020 during the same period.


Bangladesh's top import products are Mineral Fuels & Oils (US$ 7631 Million), Cotton (US$ 5965 Million), Machinery, Mechanical Appliances, etc. (US$ 4386 Million), Electrical Machinery and Electronics (US$ 2666 Million) and Animal or Vegetable Fats & Oils (US$ 2585 Million) between December 2019 to November 2020.

ChapterChapter DescriptionPrevious Month
Oct, 2020 ( US$ MM )
Current Month
Nov, 2020 ( US$ MM )
Total Value in
Last 12 Months ( US$ MM )
Total % in
Last 12 Months
Chapter 27Mineral Fuels & Oils7832626940763101827014.67%
Chapter 52Cotton5269440410596597121511.47%
Chapter 84Machinery, Mechanical Appliances, etc.426226419043862331708.43%
Chapter 85Electrical Machinery and Electronics249802911026668616805.13%
Chapter 15Animal or Vegetable Fats & Oils216036782025850052044.97%
Chapter 72Base Metal and Articles216812302025526288164.91%
Chapter 10Cereals236503161020159134593.87%
Chapter 39Plastics193759277019895456683.82%
Chapter 25Salt, Sulphur, Cement etc.138997831014249959852.74%
Chapter 54Man-made Filaments113660654012546165152.41%
Chapter 55Man-made Staple Fibres96130774012154324292.34%
Chapter 12Oil Seeds and Oleaginous Fruits55268230012097383682.33%
Chapter 17Sugar & Sugar Confectionery78604054011341128932.18%
Chapter 60Knitted or Crocheted Fabrics110851346010744020872.07%
Chapter 87Vehicles11209310409644768561.85%
Chapter 29Organic Chemicals7804411009437750991.81%
Chapter 07Edible Vegetables and Certain Roots3972980309038385991.74%
Chapter 89Ships, Boats & Floating Structures11896604508369279921.61%
Chapter 73Iron & Steel Articles6774683507128951071.37%
Chapter 31Fertilisers7819607506957020011.34%
Chapter 38Miscellaneous Chemical Products6259978206502512601.25%
Chapter 32Tanning or Dyeing Extracts6244941406383919961.23%
Chapter 48Paper and Paperboard5079754805666186381.09%
Chapter 90Optical, Photographic, Medical Equipment4183069905362307341.03%
Chapter 62Not Knitted or Crocheted Apparel & Clothing4265035304724866860.91%
Chapter 23Food Industry Waste3216092504534572660.87%
Chapter 28Chemical Industry Products3198983203831732180.74%
Chapter 09Coffee, Tea, Mate & Spices2766630803777108220.73%
Chapter 88Aircraft, Spacecraft and Parts1106714003689618880.71%
Chapter 04Dairy Products1943510103651633170.7%
Chapter 08Edible Fruits and Nuts4839116303537460290.68%
Chapter 76Aluminium and its Articles2210101303498075510.67%
Chapter 40Rubber3173292702923857460.56%
Chapter 96Miscellaneous Manufactured Articles2356183902544922420.49%
Chapter 30Pharma Products2774717102548524750.49%
Chapter 59Impregnated, Coated or Laminated Textile Fabrics2079037202435587840.47%
Chapter 58Special Woven Fabrics2134028102353634950.45%
Chapter 74Copper and its Articles1479460902019172490.39%
Chapter 26Ores, Slag & Ash1686750001776299760.34%
Chapter 34Soap, Washing Preparations, etc.1568534701713446320.33%
Chapter 53Other Vegetable Textile Fibres1267305401435326240.28%
Chapter 64Footwear & Gaiters1609212701440770610.28%
Chapter 49Printed Books, Newspapers, etc.2197844301393585860.27%
Chapter 47Wood Pulp1083212201357348320.26%
Chapter 79Zinc and its Articles781838601268442090.24%
Chapter 41Raw Hides and Skins1419502601266334190.24%
Chapter 56Wadding, Special Yarns, etc.1094861901139197490.22%
Chapter 19Preparations of Cereals1290829101120517830.22%
Chapter 83Miscellaneous Articles of Base Metal129784780962583740.19%
Chapter 33Essential Oils & Resinoids93675790979878260.19%
Chapter 35Albuminoidal Substances90846470996945570.19%
Chapter 44Wood48826820954976700.18%
Chapter 68Stone, Plaster & Cement Articles57291580946945750.18%
Chapter 94Furniture, Bedding, etc.52325220862875510.17%
Chapter 21Miscellaneous Edible Preparations65893610890376520.17%
Chapter 86Railway or Tramway Locomotives76991810794510760.15%
Chapter 70Glass and Glassware82132530768957930.15%
Chapter 93Arms and Ammunition54486410591437380.11%
Chapter 78Lead and its Articles63780080551576310.11%
Chapter 69Ceramic Products48211870494698390.1%
Chapter 03Fish and Crustceans41407590537379910.1%
Chapter 51Wool and Yarn10081420445024720.09%
Chapter 82Tools, Cutlery, Spoons, Forks of Base Metal38531770396518910.08%
Chapter 05Animal Origin Products13641510395809750.08%
Chapter 63Other Made up Textile Articles28267540397720770.08%
Chapter 67Prepared Feathers and Articles10625270240331510.05%
Chapter 95Toys, Games and Sports Requisites28628700260325520.05%
Chapter 24Tobacco7251820185722940.04%
Chapter 37Photographic or Cinematographic Goods15775680207273920.04%
Chapter 42Leather Articles17667910226949200.04%
Chapter 01Live Animals10880250220246980.04%
Chapter 02Meat611630215919480.04%
Chapter 11Milling Industry Products15724470222057790.04%
Chapter 13Lac Gums, Resins and Other Vegetable Saps & Extracts14736020156631150.03%
Chapter 61Knitted or Crocheted Apparel & Clothing1130356097807980.02%
Chapter 18Cocoa11468500102026570.02%
Chapter 22Beverages, Spirits and Vinegar8674670102304280.02%
Chapter 20Preparations of Vegetables, Fruits & Nuts10077640108179140.02%
Chapter 81Other Base Metals236227027142180.01%
Chapter 57Carpets and Other Textile Floor Coverings660443047433000.01%
Chapter 91Clocks and Watches375817038067910.01%
Chapter 65Headgear362710039197850.01%
Chapter 14Vegetable Planting Materials400290032969630.01%
Chapter 80Tin and its Articles744028725910.01%
Chapter 71Pearls and Precious Stones272125048376010.01%
Chapter 46Straw and Other Manufactured Plaiting Materials2158702868260%
Chapter 50Textile Articles3337906781870%
Chapter 66Umbrellas, Walking-sticks, etc.75740024547320%
Chapter 36Explosives and Pyrotechnic Products117119024312450%
Chapter 43Furskins and Artificial Fur52306270060%
Chapter 45Cork1175002542870%
Chapter 97Art Work and Antiques2411802093490%
Chapter 98Passengers' Baggage, Personal Implementation595603817090%
Chapter 16Prepared Foodstuffs227201015714020%
Chapter 06Live Trees and Other Plants13943307396640%
Chapter 92Musical Instruments182882015509550%
Chapter 75Nickel and its Articles37373010136670%

Bangladesh's Top Import Partners

Bangladesh's Top Import Trading Partners are China (24.07%), India (12.48%), Singapore (5.71%), USA (4.66%), and Indonesia (4.49 and Kamalapur Dhaka (0.97%). These stats are based on between December 2019 to November 2020.

Country Value (%) Value (USD million)
China24.0712524
India12.486495
Singapore5.712968
USA4.662425
Indonesia4.492336
Brazil4.232198
Japan3.912033
Malaysia3.411774
Qatar2.731420
South Korea2.341216
Russia2.081084
United Arab Emirates1.981028
Saudi Arabia1.89982
Canada1.87975
Argentina1.8939
Germany1.61837
Thailand1.61837
Taiwan1.61836
Vietnam1.36709
Australia1.27659
Pakistan1.19620
Ukraine0.97506
Italy0.92481
Turkey0.6310
Benin0.57295
Hong Kong0.54283
Bangladesh0.52269
New Zealand0.51266
France0.47243
United Kingdom0.45235
Switzerland0.44230
Kuwait0.4210
South Africa0.38196
Netherlands0.35181
Spain0.34176
Oman0.31162
Belgium0.31159
Mali0.3157
Nigeria0.28144
Myanmar0.27139
Finland0.26134
Burkina Faso0.26133
Cameroon0.23122
Algeria0.22115
Egypt0.19100
Denmark0.1789
Belarus0.1684
Cote d Ivoire0.1578
Austria0.1575
Saint Barthelemy0.1474
Sri Lanka0.1473
Sweden0.1472
Tajikistan0.1263
Tunisia0.1263
Greece0.1263
Philippines0.1157
Jordan0.1155
Morocco0.151
Czechia0.150
Poland0.150
Ireland0.0946
Bhutan0.0843
Chile0.0842
Paraguay0.0738
Peru0.0737
Bulgaria0.0736
Uzbekistan0.0735
Norway0.0633
Kazakhstan0.0630
Brunei0.0629
Iraq0.0629
Uruguay0.0528
Zambia0.0526
Bahrain0.0526
Mexico0.0526
Liberia0.0421
Chad0.0421
Tanzania0.0421
Hungary0.0419
Zimbabwe0.0317
Romania0.0316
Guatemala0.0316
Portugal0.0315
Croatia0.0314
Equatorial Guinea0.0314
Afghanistan0.0314
Mauritius0.0212
Unknown0.0212
Suriname0.0211
Malta0.0210
Togo0.029
Papua New Guinea0.028
Senegal0.028
Gabon0.017
Turkmenistan0.016
Lithuania0.016
Cambodia0.016
New Caledonia0.015
Latvia0.014
Nepal0.014
Moldova0.014
Slovakia0.014
Mozambique0.014
Luxembourg0.014
Kenya0.014
Cyprus0.013
Venezuela0.013
Ghana0.013
Sudan0.013
Slovenia03
Bosnia and Herzegovina02
Maldives02
Uganda02
San Marino02
Malawi02
Macao02
Namibia02
Gambia02
Eswatini01
Ethiopia01
Dominican Republic01
Mongolia01
Estonia01
Vanuatu01
Laos01
Guinea01
Costa Rica01
Lebanon01
Sierra Leone01
El Salvador01
Yemen01
Honduras01
Solomon Islands01
Azerbaijan01
North Korea01
Central African Republic00
Lesotho00
Fiji00
Guyana00
Congo00
Colombia00
Iceland00
Ecuador00
Kiribati00
Libya00
Mauritania00
Kyrgyzstan00
Dominica00
Madagascar00
Georgia00
Angola00
Iran00
Nicaragua00
Macedonia00
Puerto Rico00
Tokelau00
French Guiana00
Samoa00
Mayotte00
Panama00
Barbados00
South Georgia and the South Sandwich Islands00
Sao Tome and Principe00
DR Congo00
Albania00
Antigua and Barbuda00
Gibraltar00
Belize00
Syria00
Marshall Islands00
Czechoslovakia00
Bouvet Island00
Jamaica00
Reunion00
Saint Vincent and the Grenadines00
South Sudan00
No data, work code00
British Virgin Islands00
US Virgin Islands00
Niger00
Tonga00
Israel00
Armenia00
Somalia00
Turks and Caicos Islands00
Cocos Keeling Islands00
Kosovo00
Monaco00
Falkland Islands00
Timor Leste00
Saint Helena00
Botswana00
Ceuta00
Christmas Island00
Guam00
Andorra00
Cook Islands00
Cape Verde00
Vatican City00
Bahamas00
Rwanda00
Palau00
Trinidad and Tobago00
Comoros00
Cuba00
Guadeloupe00
Seychelles00
Liechtenstein00
Antarctica00
Anguilla00
Isle of Man00
United States Minor Outlying Islands00
Martinique00
Niue00
Western Sahara00
Nauru00
Aruba00
Bermuda00
Saint Kitts and Nevis00
American Samoa00
Wallis and Futuna00
Heard Island and McDonald Islands00
Bolivia00
Djibouti00
Montserrat00
Grenada00

Major Import Ports in Bangladesh

Bangladesh's Top Major Ports in Imports are Chittagong (81.18%), Dhaka (6.82%), Unknown (6.72%), Jessore (2.57%), between December 2019 to November 2020.

Bangladesh Import Ports Value (%) Value (USD million)
Chittagong81.1842233
Dhaka6.823550
Unknown6.723495
Jessore2.571339
Kamalapur Dhaka0.97504
Rooppur Lc Station0.44229
Sonamosjid LCS0.31163
Hili LC station Bangladesh0.25132
Custom House Pangaon0.1895
Cox's Bazar0.1684
Burimari0.150
Narayanganj0.0738
Banglabandha0.0632
Bhomra0.0524
Chuadanga0.0420
Chittagong EPZ0.0211
Khulna0.0210
Tamabil0.016
SAPL Inland Water ContainerTerminal0.015
Basse Terre02
Ahaura01
Mongla00
Ishurdi00
Agua Buena00
Pointe Noire00
Alibag00
Isola d'Asti00
Ali Sabieh00
Abenra00
Abovyan00
Akieni00
Adamjee EPZ00
Cotegipe00
Al Udeid00
Ama Shimane00
Zanaga00
Annapurna00
Pabna00

Top Importers and Foreign Suppliers in Bangladesh

Importers in Bangladesh Value (%) Value (USD million)
BANGLADESH OIL GAS & MINERAL24.321866
PADMA OIL COMPANY LIMITED13.831061
MEGHNA PETROLEUM LIMITED13.581041
JAMUNA OIL CO LIMITED10.43800
EASTERN REFINERY LIMITED10.12777
SHABNAM VEGETABLE OIL INDUSTRIES LIMITED7.09544
CITY SUGAR INDUSTRIES LIMITED5.69437
CITY SEED CRUSHING INDUSTRIES LIMITED5.6430
CITY EDIBLE OIL LIMITED FACTORY CITY ECONOMIC ZONE LIMITED4.85372
MEGHNA EDIBLE OILS REFINERY LIMITED4.5345

Importers in Bangladesh

Here is List of Top Importers in bangladesh with their import value recorded in December 2019 to November 2020. Analyze bangladesh companies business performance with the help of our detailed bangladesh Import data. Understand each & every import Shipment activity of bangladesh buyers online.

Foreign Suppliers

Who are the top foreign Suppliers to bangladesh? Check the list of major import companies shipping goods to bangladesh with their value which is recorded between December 2019 to November 2020.

Foreign Suppliers Value (%) Value (USD million)
QATAR GAS OPERATING COMPANY LIMITEDDOHA,QATAR.AGENT:RAS LAFFAN LIQUIFIED NATURAL GAS COM.Ltd17.19901
UNIPEC SINGAPORE PTE LTD14.83777
VITOL ASIA PTE LTD11.73615
OMAN TRADING INTERNATIONAL LIMITED ( OTI )11.41598
AGROCORP INTERNATIONAL PTE LTD10.07528
LOUIS DREYFUS COMPANY SUISSE SA8.56449
UNIPEC SINGAPORE PTE. LTD.7.69403
AGROCORP INTERNATIONAL PTE LTD.7.57397
SAUDI ARABIAN OIL CO. LTD.5.48287
M/S,BOEING COMPANY5.47287